
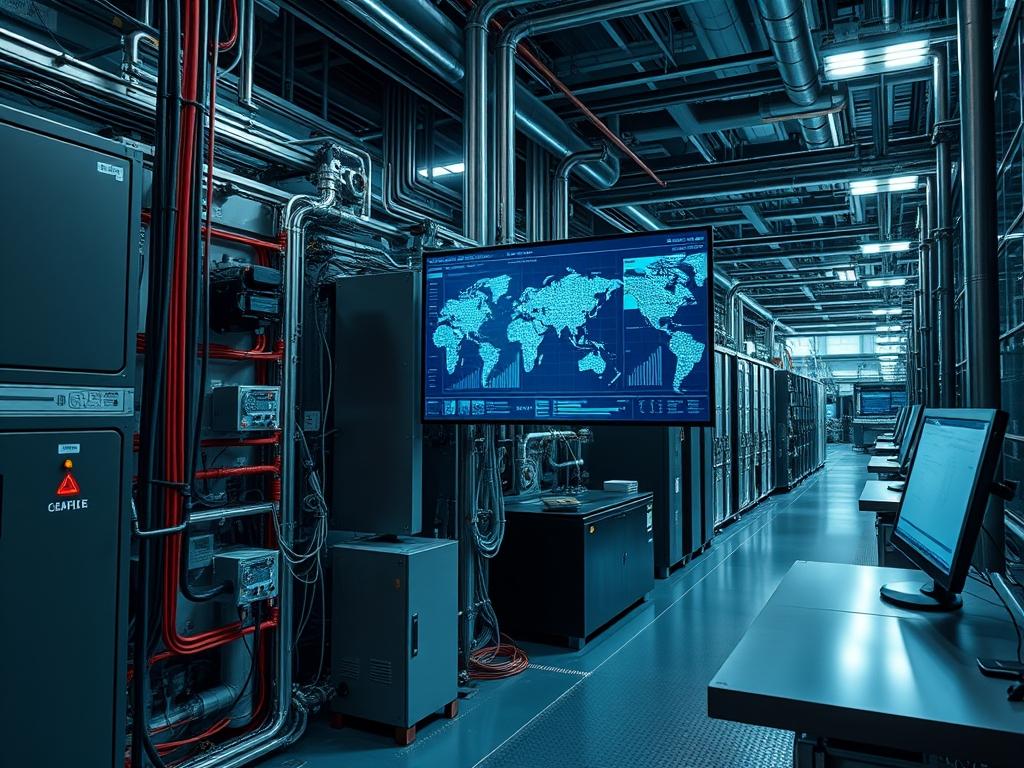
Daily Load Calculation serves as the primary metric for balancing energy distribution and cooling capacity within hyper-scale data centers and industrial control environments. This process quantifies the energy consumption of active hardware, cooling overhead, and power distribution losses over a rolling 24-hour window to maintain operational stability. Daily Load Calculation directly informs the sizing of uninterruptible power supply (UPS) banks, generator fuel reserves, and branch circuit breaker thresholds. Without accurate load calculations, facilities risk circuit overloads during peak demand or inadequate thermal clearance during high-density compute tasks. By integrating real-time telemetry from SNMP-enabled PDUs and Modbus industrial meters, Daily Load Calculation provides the analytical framework for capacity planning and incident prevention. The process accounts for the non-linear relationship between server utilization and power draw, incorporating Power Usage Effectiveness (PUE) as a scaling factor for facilities management. Operational dependencies include high-resolution metering, synchronized clock cycles for time-stamped logs, and low-latency network paths for telemetry aggregation. Failure to execute these calculations precisely leads to stranded capacity, thermal throttling, or critical system outages during failure-mode transitions.
Technical Specifications
| Parameter | Value |
| :— | :— |
| Operating Voltage | 208V, 415V, or 480V AC Three-Phase |
| Communication Protocols | SNMPv3, Modbus TCP/RTU, BACnet, IPMI 2.0 |
| Sampling Interval | 1 second to 60 seconds (Granular Telemetry) |
| Industry Standards | IEEE 446, NFPA 70 210.19, ASHRAE Class A1-A4 |
| Default Service Ports | 161 (SNMP), 502 (Modbus), 623 (IPMI) |
| Power Factor Range | 0.90 to 0.99 (Leading or Lagging) |
| Security Protocol | TLS 1.3, AES-256 Encryption for Telemetry |
| Recommended Hardware | Managed PDUs, Branch Circuit Monitors (BCM) |
| Throughput Thresholds | 10k samples per second per aggregator |
—
Configuration Protocol
Environment Prerequisites
Systems must satisfy specific hardware and software requirements before initiating a Daily Load Calculation. Managed Power Distribution Units (PDUs) must run firmware versions supporting SNMPv3 with AES-256 encryption. Industrial controllers require Modbus register maps provided by the manufacturer to ensure correct scaling factors for voltage and amperage readouts. The monitoring environment requires a dedicated Linux instance (RHEL 8+ or Ubuntu 20.04+) with Net-SNMP and Python 3.x installed. Networking must allow traffic through internal firewalls via port 161 for UDP traps and port 502 for TCP polling. Physical infrastructure must verify that all branch circuits are labeled according to NEC 210.19 standards to map software-defined loads to physical breakers.
Implementation Logic
The engineering rationale for Daily Load Calculation relies on the 80 percent rule, where continuous loads must not exceed 80 percent of the circuit rated capacity. The calculation architecture follows a tiered aggregation model. Individual server power draw is captured via IPMI or Redfish APIs, then aggregated at the PDU level. These totals are then cross-referenced with upstream Switchgear and UPS metrics. This multi-point validation identifies transmission losses and potential harmonic distortion issues. The logic incorporates thermal inertia: the delay between a power spike and the resultant increase in ambient temperature. By correlating cooling demand (in BTUs) with electrical load (in Watts), the system predicts HVAC ramp rates necessary to prevent thermal runaway in high-density racks.
—
Step By Step Execution
Phase 1: Telemetry Asset Discovery
Establish a baseline of all power-consuming assets using a network crawler or management console. This step ensures that every rack-mounted device is accounted for in the total aggregate. Use snmpwalk to verify connectivity and OID availability for current and voltage.
“`bash
snmpwalk -v3 -l authPriv -u monitor_user -a SHA -A auth_pass -x AES -X priv_pass 192.168.10.50 1.3.6.1.4.1.318.1.1.12
“`
System Note: The OID 1.3.6.1.4.1.318 is specific to APC/Schneider Electric devices; use manufacturer-specific MIB files for alternate hardware. This command tests the authentication and privacy layers of the protocol.
Phase 2: Real Time Load Polling
Configure a daemonized service to poll the Modbus registers or SNMP objects at 30-second intervals. High-frequency polling is necessary to capture in-rush currents that occur during hardware boot cycles or database indexing bursts.
“`python
import minimalmodbus
instrument = minimalmodbus.Instrument(‘/dev/ttyUSB0’, 1) # port name, slave address
power_load = instrument.read_register(3000, 1) # reg number, number of decimals
print(f”Current Load: {power_load} Watts”)
“`
System Note: Ensure parity and baud rate settings on the serial gateway match the physical meter configuration to prevent frame errors and data corruption.
Phase 3: Thermal Load Conversion
Calculate the heat dissipation based on the electrical load. In data center environments, nearly 100 percent of electrical energy is converted to heat. Use the conversion factor of 1 Watt = 3.412 BTU/hr to determine the required sensible cooling capacity.
“`python
def calculate_btu(watts):
return watts * 3.412
total_load_kw = 45.5
required_cooling_btu = calculate_btu(total_load_kw * 1000)
“`
System Note: This calculation determines the minimum throughput for CRAC (Computer Room Air Conditioning) units. Always add a 20 percent safety margin to the result to account for environmental fluctuations.
Phase 4: Data Aggregation and Daily Averaging
Store polled values in a time-series database like Prometheus or InfluxDB. Execute a query to calculate the mean load over the 24-hour cycle while identifying the peak demand point (Peak KVA).
“`sql
SELECT mean(“value”) FROM “power_load” WHERE time > now() – 24h GROUP BY time(1h)
“`
System Note: Identify the “Peak-to-Average” ratio. A ratio exceeding 1.5 indicates volatile workloads that may require aggressive auto-scaling or upgraded circuit protection.
—
Dependency Fault Lines
Reliability in Daily Load Calculation is often compromised by signal attenuation in long-run RS-485 cabling used for Modbus. If the cable shield is not properly grounded at a single point, electromagnetic interference from high-voltage lines induces noise, leading to dropped packets and inaccurate load readings.
Permission conflicts within Linux also act as a common failure point. If the telemetry collector service lacks read/write access to /dev/ttyUSB0 or cannot bind to low-level UDP ports, data ingestion will fail silently. Use udev rules to persist device permissions across reboots.
Port collisions occur when multiple monitoring tools attempt to bind to port 161. If an existing net-snmp daemon is active, custom collectors will fail to initialize. Verification is performed via netstat -tulpen | grep 161.
Thermal bottlenecks occur when the Daily Load Calculation ignores the impact of fan power. High-speed server fans can consume up to 15 percent of a chassis total power at 100 percent PWM duty cycle. If the calculation only uses idle power baselines, the circuit will trip during high-temperature events.
—
Troubleshooting Matrix
| Issue | Symptom | Verification Command | Remediation |
| :— | :— | :— | :— |
| SNMP Timeout | No data in collector | `snmpget -v3 …` | Check firewall rules; verify community strings |
| CRC Errors | Garbled Modbus data | `journalctl -u modbusd` | Check RS-485 termination resistors (120 ohm) |
| Stale Data | Load values never change | `ipmitool sdr list` | Reset the BMC on the target server |
| THD Alarm | High harmonic noise | `snmptrapd -f -Lo` | Inspect VFDs and non-linear power supplies |
| Clock Drift | Out-of-sync logs | `timedatectl status` | Synchronize all nodes to a local NTP Stratum 1 |
Realistic journalctl output for a failed connection:
`snmpd[1024]: Connection from UDP: [10.20.30.40]:54321->[10.20.30.1]:161 refused: Access Denied.`
This entry indicates a mismatch in the hosts.allow configuration or an incorrect USM (User-based Security Model) profile.
—
Optimization And Hardening
Performance Optimization
To reduce latency in a Daily Load Calculation, implement a localized telemetry proxy. Rather than polling 500 individual PDUs from a central server, deploy localized collectors per row. These collectors aggregate data and ship compressed payloads to the central database. This reduces network overhead and prevents congestion on backbone switches. Tune the kernel-space network buffers for the collector to handle high UDP packet volume during burst events.
Security Hardening
Hardening the Daily Load Calculation infrastructure requires moving from SNMPv2c to SNMPv3 with AuthPriv. This ensures that power consumption data, which can reveal operational patterns to attackers, is encrypted in transit. Isolate the management network on a dedicated VLAN with no external routing. Implement stateful inspection on the perimeter firewall to only allow known aggregator IPs to communicate with the power hardware.
Scaling Strategy
For horizontal scaling, utilize a load balancer to distribute telemetry polling across multiple worker nodes. If a single node fails, the peer nodes assume the polling duties without data loss. Redundancy design should include N+1 power meters. If a primary meter fails, the system switches to the redundant meter via a secondary Modbus gateway. Capacity planning must account for 20 percent head-room in all calculations to accommodate future hardware refreshes.
—
Admin Desk
How do I handle missing telemetry data in my daily average?
Use linear interpolation for gaps shorter than five minutes. If data exceeds a 15-minute gap, mark the Daily Load Calculation as “Incomplete.” Use the maximum rated nameplate power for that duration to ensure a conservative safety margin for cooling.
Why is the PDU reading higher than the server IPMI?
The PDU measures the power draw at the outlet, which includes the loss from the server power supply unit (PSU). IPMI often reports component-level consumption. Use the PDU value for circuit sizing and the IPMI value for per-app billing.
What causes a “Phase Imbalance” alert during load calculations?
Phase imbalance occurs when power-consuming devices are not distributed evenly across L1, L2, and L3 in a three-phase system. This creates excessive neutral current. Redraw the Daily Load Calculation by individual phase to identify which leg requires load shedding.
How often should I update the PDU MIB files?
Update MIB files whenever firmware is upgraded on the hardware. Manufacturers often change OID mappings to support new features like per-outlet switching. Use snmptranslate to verify that OIDs resolve to the correct human-readable strings after any update.
Can I run load calculations over a standard WiFi network?
Wireless networks introduce variable latency and packet loss that corrupt high-frequency telemetry. Only use wired 802.3 Ethernet or shielded RS-485 for Daily Load Calculation to ensure the integrity of the 24-hour data set and prevent false-positive breaker alerts.